
July 20: NISAR unlocks public radar data, and Antarctica sends back a 'hummingbird'
NISAR teams begin continuous access to L-band and S-band products, turning glacier stress into signal-level science.

NASA and ISRO's NISAR (NASA-ISRO Synthetic Aperture Radar) satellite is making public radar data available as of July 20, using both L-band and S-band instruments. For decision-makers, the move accelerates how researchers can monitor land and ice change, including natural hazards, with radar views that optical sensors miss.
On July 20, the public can access data from the two radar instruments aboard the U.S.-India NISAR satellite, and one of the first striking releases shows an Antarctic scene that looks like a hummingbird. It is not a metaphor for marketing. It is a real glacier-and-mountain geometry: scientists used NISAR's L-band radar to map Nunatak Zaterjavshijsja in East Antarctica, where stresses from a mountaintop protruding into a northeast-flowing ice stream heavily fracture the surrounding ice, creating deep crevasses.
Why that “hummingbird” matters immediately is because radar sees differently than optical cameras. The release explains that NISAR can observe hidden properties beneath snow and ice. The Antarctic “hummingbird” image is produced from L-band measurements gathered in August 2025, and the color key tells the story in microwave language: magenta corresponds to signals returning with horizontal polarization, consistent with more regular surfaces such as smooth ice; green corresponds to signals returning with vertical polarization, linked to refraction and scattering from irregular surfaces or partial penetration into the snow and ice (volume scattering).
This isn’t a one-off art project. It is the operational on-ramp to a mission that scans nearly the entire planet’s land- and ice-covered areas at a high cadence. Since NISAR’s July 30, 2025 launch from India’s Satish Dhawan Space Centre, NASA and ISRO engineering and science teams have been calibrating instrumentation, refining algorithms, and monitoring Earth’s land and ice surfaces nearly all twice every 12 days. Along the way, teams have captured scenes ranging from urban street grids and agricultural fields to landslides, earthquakes, and sinking land in Mexico City. The point: NISAR is built to turn that frequency into usable datasets for downstream science and applications.
From a governance and data-access standpoint, July 20 is also about workflow, not just discovery. NASA says teams in the United States and India will release files processed from NISAR’s L-band and S-band radars on an ongoing basis. The Indian science team, based at ISRO’s Space Applications Centre in Ahmedabad, recently started releasing S-band data via the Bhoonidhi portal. On July 20, the U.S. side began releasing calibrated products continuously for all L-band measurements collected since June 17, with an expectation that by the end of the year the team will have released all data acquired earlier during science operations.
The operational detail to notice is that NISAR's data output is vast, on the order of dozens of terabytes a day, because the satellite provides frequent coverage from within a few degrees of the South Pole in Antarctica to 77.5 degrees north latitude, above the Arctic Circle. That scale is exactly why the “where do I get the files” portion matters to researchers and other users who might build tools on top of NISAR. The source states that users can download the latest files at the Alaska Satellite Facility Distributed Active Archive Center in Fairbanks, which hosts and distributes all NASA synthetic aperture radar data. It also notes that this is the first free-flying space mission to feature two radar instruments, an L-band system and an S-band system, with complementary wavelengths.
For executives tracking tech maturation, procurement-ready data pipelines, or public-sector data releases, the wavelength pairing is the strategic engine. The longer-wave L-band can pass through tree canopies, imaging the ground beneath. Meanwhile, depending on leaf sizes, S-band can collect observations of those canopies. In other words, the mission isn’t just “more radar.” It is two bands targeting two different ways surfaces interact with electromagnetic waves, which increases the odds that whatever you are trying to measure, the radar can find a signal path.
There is also a second-order implication in the Antarctic example: it demonstrates radar’s practical advantage in environments where optical imagery struggles. The release states that an optical view of the same scene is almost entirely white with ice and snow, with only slight shadows and rippling hinting at the mountaintop and textures implying the ice is not completely smooth. Because microwaves can penetrate frozen surfaces, NISAR’s L-band radar captured more detail of the structure of the surrounding icescape than the optical image. That advantage is directly relevant to monitoring changes in ecosystems like forests and wetlands, and to responding to natural hazards such as landslides and earthquakes. If your monitoring pipeline depends on visible contrast, radar can be the difference between “we saw something” and “we can measure what it is doing.”
Finally, this July 20 data release is timed as NASA and ISRO prepare to celebrate the first anniversary of NISAR’s July 30, 2025 launch. Managed by Caltech, JPL leads the U.S. component and provided the satellite’s L-band SAR and antenna reflector, while ISRO provided the spacecraft bus and its S-band SAR. The mission’s radar architecture includes a giant drum-shaped reflector that measures 39 feet (12 meters) wide, described as the largest radar antenna reflector NASA has sent into space. For peers across aerospace, Earth observation, and infrastructure-facing analytics, the message is clear: when public datasets go from limited releases (like the January release of about 25 sample products and the February release of thousands of pre-calibrated products) to continuous calibrated access, the whole ecosystem of users can iterate faster, test models sooner, and move from pretty pictures to operational intelligence.
This story's Key Insights and Take-aways are locked.
Create a free account to unlock Executive Actions for one credit.
Register to UnlockAlways free for Executives Club members. Join the Club
More in Science
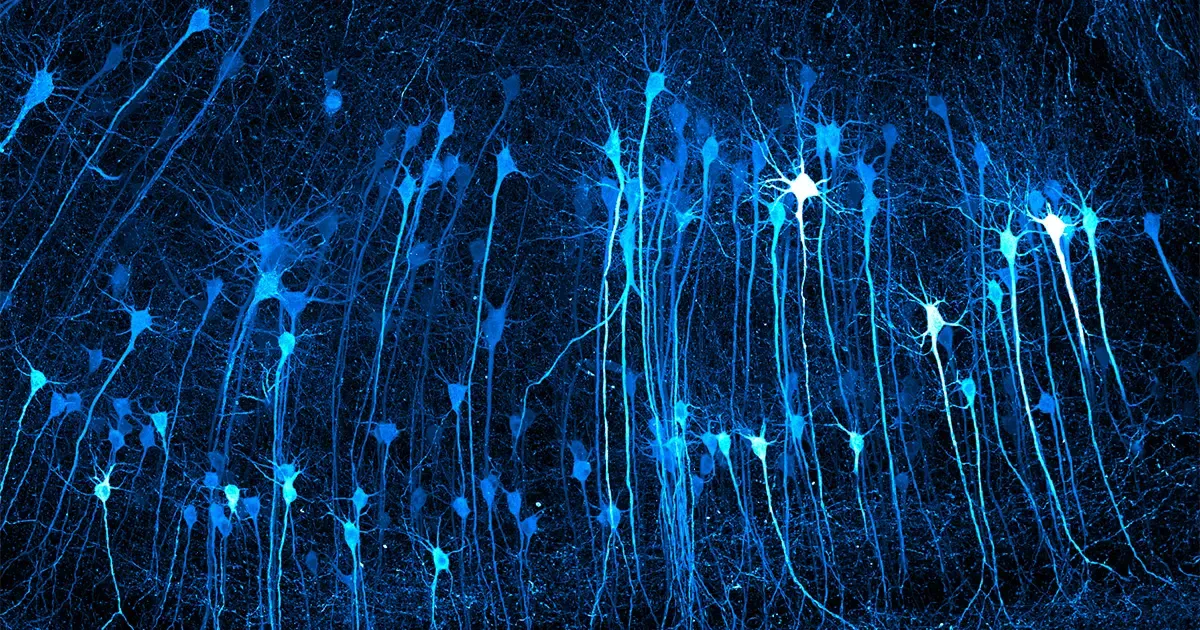
2026 Nikon Small World Winners Reveal the Hidden Machinery of Everyday Life
A mycologist's frozen Edinburgh garden became the backdrop for vivid views inside cells, a reminder of what advanced imaging now makes visible to researchers and the industries built on biology.

Study: 1 in 4 depression cases may be a body-clock problem, not a chemical one
A 10,000-person study finds standard antidepressants often fail these patients, but melatonin and morning sunlight may hit the real root cause.
Start-Up Says A.I. Designed a Virus to Attack One Patient's Superbug
If the claim holds up, personalized phage therapy could become a new frontline weapon against antibiotic resistance - but proof is far from final.